Intruder is one of the first tool that any Burp Suite user interacts with. Behind its appearing simplicity, large-scale efficient usage isn’t straightforward and requires some preparation. When is the Pitchfork mode useful? How can we identify interesting security flaws with “Grep Match” and “Grep Extract”? Intruder is more than a simple brute-force tool, and that’s what we’ll see in this blog post.
This article is a guest blog post written by Nicolas Grégoire aka Agarri.
Why covering Burp Suite Intruder?
In this article, I will discuss Burp Suite’s Intruder, which is one of the most commonly tool of the suite, alongside Proxy History and Repeater. Why discussing such a common tool? Because I think that using it at peak efficiency is quite uncommon, and that plenty of subtle bugs were missed for this very reason. I also think that users should be able, despite large volumes of results, to 1) verify that a scan run correctly 2) identify uncommon responses. From my experience, the best way to identify such anomalous responses is to map all responses to “known states”, using built-in features like Grep Match and Grep Extract (more on that later).
Here’s the TL;DR version: ensuring that an attack run as expected, as well as analyzing responses for small differences, should be considered as core tasks and planned accordingly.
How to prepare an Intruder attack?
Before processing responses, we first have to emit some traffic. The most common way to initialize an Intruder tab is to use the contextual menu (action “Send to Intruder”) or the corresponding keyboard shortcut (by default “Control-I”). It is interesting to note that this action will send more than the request, as the base unit in Burp Suite is the exchange (a request + a response). That’s easy to verify: send a message to Intruder and go to “Options > Grep Extract” then click on “Add”. The new window clearly shows the response associated to the request visible in the “Positions” tab.
In “Positions”, you may want to remove, modify or add some payload markers (i.e. the “§” signs). Some users are lucky enough to have the corresponding character on their keyboard (I do, thanks to the French AZERTY layout). The remaining majority probably want to configure the “Add Intruder payload position marker” shortcut (from “User options > Misc > Hotkeys”): it either inserts a “§” under the cursor or surround the selected text with it. For users of the Pro version willing to execute an automatic audit while customizing the targeted injection points, that’s possible from Intruder, using the “Scan defined insertion points” action available from the “Positions” contextual menu. Very useful for minimizing the scope (and therefore the duration) of scans!
Which attack and payload types?
I will not review all the attack types (which are “Sniper”, “Battering ram”, “Pitchfork” and “Cluster bomb”), but keep in mind that “Battering ram” is mostly a stripped-down version of “Pitchfork”. The latter is useful in a bunch of common scenarios, and can be used to automatically manage anti-CSRF tokens, when mixed with the “Recursive Grep” payload type. That’s described in details in the following blog post, using DWVA as the test-bed so that you can replicate at home.
Regarding payload types, there’s no point in reviewing all of them: the official documentation is quite good. Here’s however a few little-known ones that I commonly use:
- “Copy other payload” combined with “Pitchfork”, when one position stores a value “x” and another position stores “f(x)” (for example its SHA256 hash). Also doable with Hackvertor, but I stand by the Perl motto “There’s more than one way to do it”
- “Character frobber” and its sibling “Bit flipper”, which are extremely useful on opaque blobs of data, like binary or encrypted values. I used it to identify a Perl deserialization vulnerability, as described in this other blog post.
Why processing responses automatically?
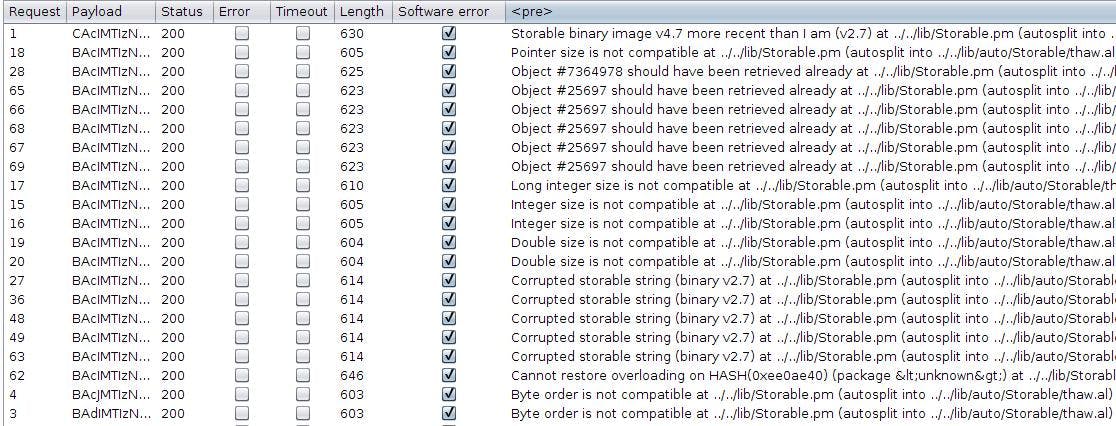
In the following screenshot (extracted from the link above), we can see that responses are processed using two filters: a “Grep Match” one (i.e. the “Software error” column) and a “Grep Extract” one (i.e. the “<pre>” column). These filters massively lower the cost (in terms of time and cognitive efforts) of analyzing the results, and I strongly recommend using this strategy as much as possible! It’s generic, easy to setup and may allow you to:
- detect possible errors in your setup, for example related to session handling rules ;
- detect unexpected outcomes, like an active session being killed by a WAF ;
- classify responses in buckets, the smallest one being usually the most interesting one.
Source: https://www.agarri.fr/docs/frobber.png
What to look for?
Beware, it is important not to focus exclusively on what I’d describe as the “business goal” (a vulnerability, a CTF flag, etc.). Monitoring the “technical goal” (i.e. verifying that the automation setup works perfectly well) may indeed be even more critical. What is the point of sending hundreds or thousands requests if you misunderstood how the target’s anti-CSRF protection works? What about identifying bugs in your macros, like a typo on a cookie name? Or, even harder, detecting a subtle race condition that will kick in only 1% of the time… Luckily, this kind of monitoring doesn’t involve exclusive extensions or secret tricks, only three stock features listed in the “Options” tab of your Intruder attack: “Grep Match”, “Grep Extract” and “Grep Payload”. The latter is the most limited one: it’s useful nearly exclusively for content injection situations (i.e. XSS) and is prone to false-positives on short strings. But I use the two remaining ones a lot!
On one hand, “Grep Match” will generate a boolean field and should be used when looking for a specific string, like “Welcome User42” or “Invalid token”. On the other hand, “Grep Extract” will generate a text field and can be useful when targeting a specific DOM element, for example “<title>…</title>” or “<div id=”error-message”>…</div>”. In both cases, complex regular expressions (using the java.util.regex.Pattern syntax) can also be used. The goal is to tag all responses, by associating them to known states. That’s, in my opinion, one of the only ways to process large amounts of responses without missing subtle clues. Some people may prefer to use Intruder’s display filter, but I don’t recommend it, as it doesn’t allow multiple parallel criteria.
Additional tips
You will quickly notice that repeatedly removing default “Grep Match” criteria is not only boring, but also time-consuming. One solution is to customize the initial settings of Intruder attacks, by setting “Intruder > New tab behavior” to “Copy configuration from first tab” (from the menu bar)
Given that the “Grep Extract” editor shows the base response sent to Intruder, it can be used to quickly pick strings to copy to “Grep Match”. That prevents switching back to Repeater or Proxy History
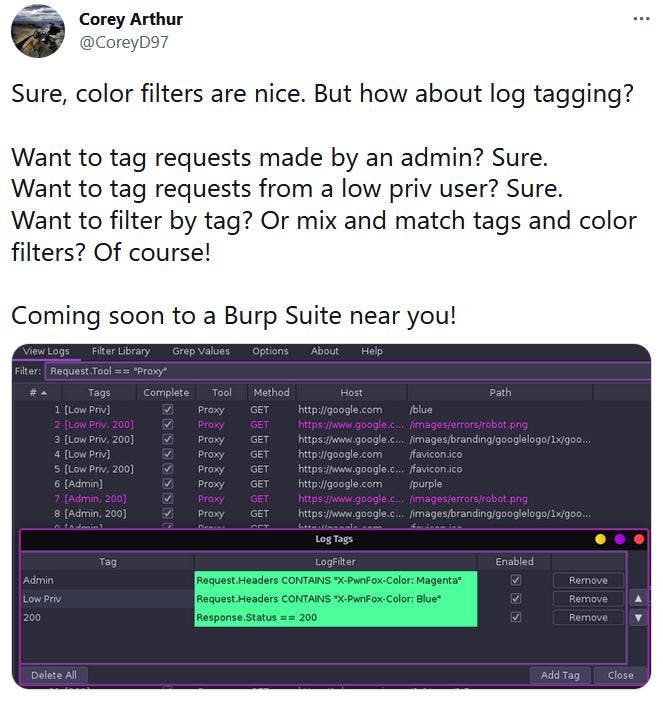
Once you get used to this strategy, you may want to go even deeper. Logger++, with its color filters and tags, is the way to go!
Source: https://twitter.com/CoreyD97/status/1394703934435037184
Conclusion, and few words about Turbo Intruder
I hope you enjoyed this opinionated view of efficient usage of Burp Suite’s Intruder! Keep in mind that you may bump into other problems when doing large-scale scans: having a GUI is limiting (how to easily run scans from a high-bandwith VPS?), storing each result in RAM is costly (how to pre-filter them?) and moderately complex processing (like recursive brute-force) isn’t available. The next step would of course be the addition of Turbo Intruder to our arsenal.
If you are new to this extension, I strongly advise starting by reading the original article published by James Kettle aka Albinowax then going through a bunch of existing scripts. Evan Custodio aka defparam wrote some interesting Turbo Intruder scripts too, I recommend exploring his gists and this GitHub repository.

